LandOffer
Topic
Data & Decisions
26 articles about Data & Decisions, newest first.
Browse the complete article archive →A Data Pipeline Passed but the Dataset Is Stale: Check Freshness Separately
Separate a successful pipeline from fresh data with a worked source and consumer timeline, age checks, missed deadlines, and a bounded recovery record.
A New Feature's Early Lift Fades: Check Novelty and Learning Effects
Check fading feature lift by first-exposure cohort, preserve immature windows, and separate novelty or learning hypotheses from a supported launch decision.
A Product Survey Has Few Responses: Check Who Is Missing Before Drawing Conclusions
Audit who is missing from a product survey. Compare invitations and replies, keep item denominators clear and build a targeted follow-up decision record.
A Segment Improved but the Overall Metric Fell: Check Aggregation Effects
Reconcile a falling overall rate with improving segments using a completed synthetic count table, exact weights, and a clearly limited fixed-mix review.
A SQL Join Doubled Your Revenue: Diagnose Fanout Before Shipping the Report
Diagnose SQL fanout with tested examples of doubled totals, equal-valued orders and unmatched rows, then reconcile a correction at the right grain.
Average Response Time Hides Slow Requests: Choose Percentiles Carefully
Compare mean, p95 and p99 on worked latency data. Correct averaged server percentiles, track counts and timeouts, and state histogram estimation limits.
Build a Metric Tree That Connects Team Work to a Product Outcome
Build a product metric tree with exact cohorts, actionable inputs and guardrails. Diagnose a flat outcome without assuming the arrows establish causation.
Check A/A Test Results Before Trusting a New Experimentation Pipeline
Review an A/A validation plan and a worked join-fanout diagnosis to check identical experiences, metric definitions and the limits of pipeline qualification.
Choose a Chart That Makes the Comparison Clear Without Distorting the Data
Compare chart choices using the same data, repair misleading axes and missing labels, and keep denominators, gaps and uncertainty visible in your analysis.
Choose a Funnel Conversion Window That Matches the User Journey
Choose a funnel conversion window from the user task. Compare 24 and 72 hours on one event log, with order, identity and mature observation checks.
Do Not Stop an A/B Test Just Because the Result Looks Significant Today
Match A/B stopping rules to the statistical method. Inspect a real offline peeking simulation and completed fixed-horizon and sequential planning records.
Estimate an Experiment's Duration Before You Commit a Release Date
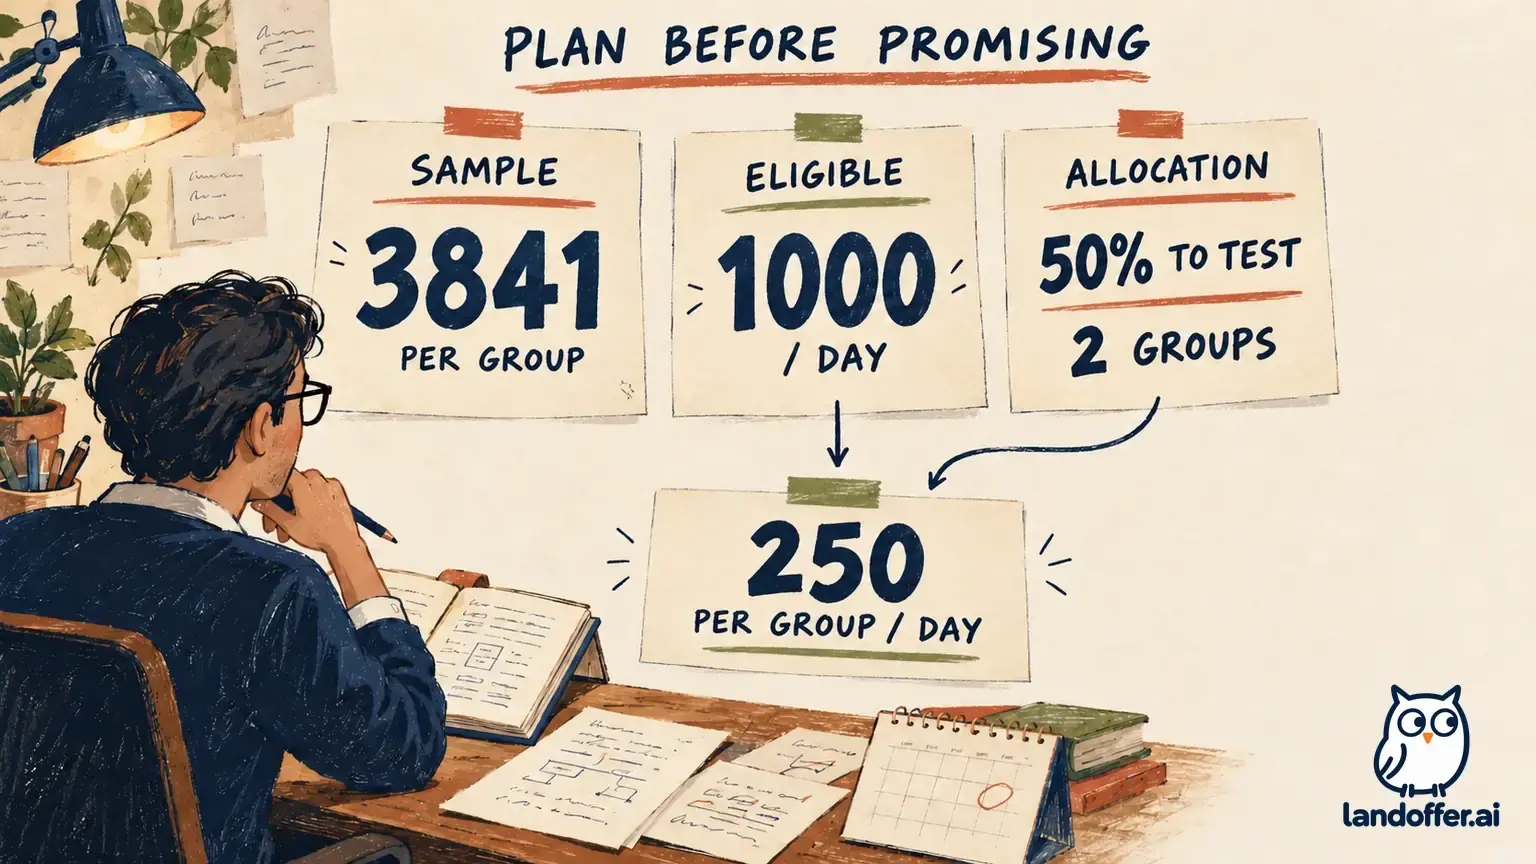
Estimate sample per group, eligible allocated traffic, exposure duration, and outcome maturity with a complete example and a revised plan when traffic halves.