LandOffer
Job search
Tableau Public Portfolio for Job Applications: Publish Useful Work Without Exposing Private Data
Tableau Public requires a public-data decision before publication. A completed synthetic backlog example shows the analysis, contribution and limits a candidate can explain.
Use Tableau Public for work whose data and explanation can be public. Hiding a visualization from your profile does not restrict access to people who have its URL. Disabling downloads is a separate control, not a way to make confidential work safe to publish. For job applications, a small, clearly explained project built from shareable data is a better choice than an impressive employer dashboard you cannot release. Show the question, your contribution, the calculation, and its limits.
LandOffer publishes this guide and offers recent job discovery, so we have a commercial interest in job-search resources. We checked Tableau's public documentation on October 13, 2026. We did not install Tableau, create an account, publish a workbook, or test recruiter behavior. Nia and the support-backlog data below are fictional; we created and checked the small dataset locally to demonstrate a release decision and analytical explanation.

Decide what can be public before choosing the dashboard
Tableau's Public FAQ describes a free platform for sharing visualizations online. Published work is publicly accessible. That makes it useful for a portfolio someone can open, but it makes the data-release decision part of the project, not a final cosmetic setting.
Start with the analysis you want to demonstrate. A data analyst might need to explain a metric definition, an aggregate comparison, and a limitation. An analytics engineer might want to explain the dataset's grain and a check against double counting. Without the metric definition and counting check, a reviewer sees the chart but cannot assess how you decided what its numbers mean. Pick an example that gives you something specific to discuss about the work in the target role.
Then inspect the material available for that example. Publicly downloadable data still needs an appropriate source, permission to reuse it, and enough context to interpret it. Alternatively, you can create a genuinely new synthetic teaching dataset. Label it as invented, and do not present its patterns as findings about a real customer or employer.
If your strongest work belongs to an employer, do not begin by exporting it and hoping to remove the sensitive columns later. First establish whether the underlying data and analysis are yours to release. When that is unresolved, keep the original out of the public project. You can demonstrate the same category of analytical reasoning using a different, shareable example without claiming it reproduces the employer's results.
Separate hidden status, downloads, and extracts
The FAQ's visibility and download sections explain that hidden vizzes disappear from the visible profile listing but remain accessible through their URL. Workbook and underlying-data downloads are enabled by default; you can disable them for a viz or change the default for new vizzes. These settings control different things. Neither makes the published analysis a private employer workspace.
Tableau's publishing instructions also say that publishing creates an extract of the data connection. The Public Edition can save workbooks locally for offline work, including private data. Saving locally and publishing to the public service are different destinations. A confidential local workbook is not a suitable public release merely because the software offers both destinations.
| Choice | What it changes in the documented workflow | What it does not establish |
|---|---|---|
| Hide a viz from the profile | Removes it from that visible listing | Private access for people with its URL |
| Disable downloads | Changes workbook and underlying-data download availability | Permission to publish confidential information |
| Publish to Public | Makes a public workbook and creates an extract | A private connection to an employer system |
| Save locally in Public Edition | Keeps that save on the local destination | That a later public upload is authorized |
Use those distinctions to choose where work belongs. A draft containing confidential records can remain local under your organization's own rules. A public portfolio should begin with material suitable for release. Do not use the hidden tab as a substitute for settling that decision.
Nia rejects an employer export and builds a separate example
Nia is a fictional analyst applying to support-operations analytics roles. Her strongest workplace dashboard includes customer names, ticket text, individual agent activity, and contractual response commitments. In this example, she has no authorization to publish it. Renaming customers would not settle the release of everything else in that workbook.
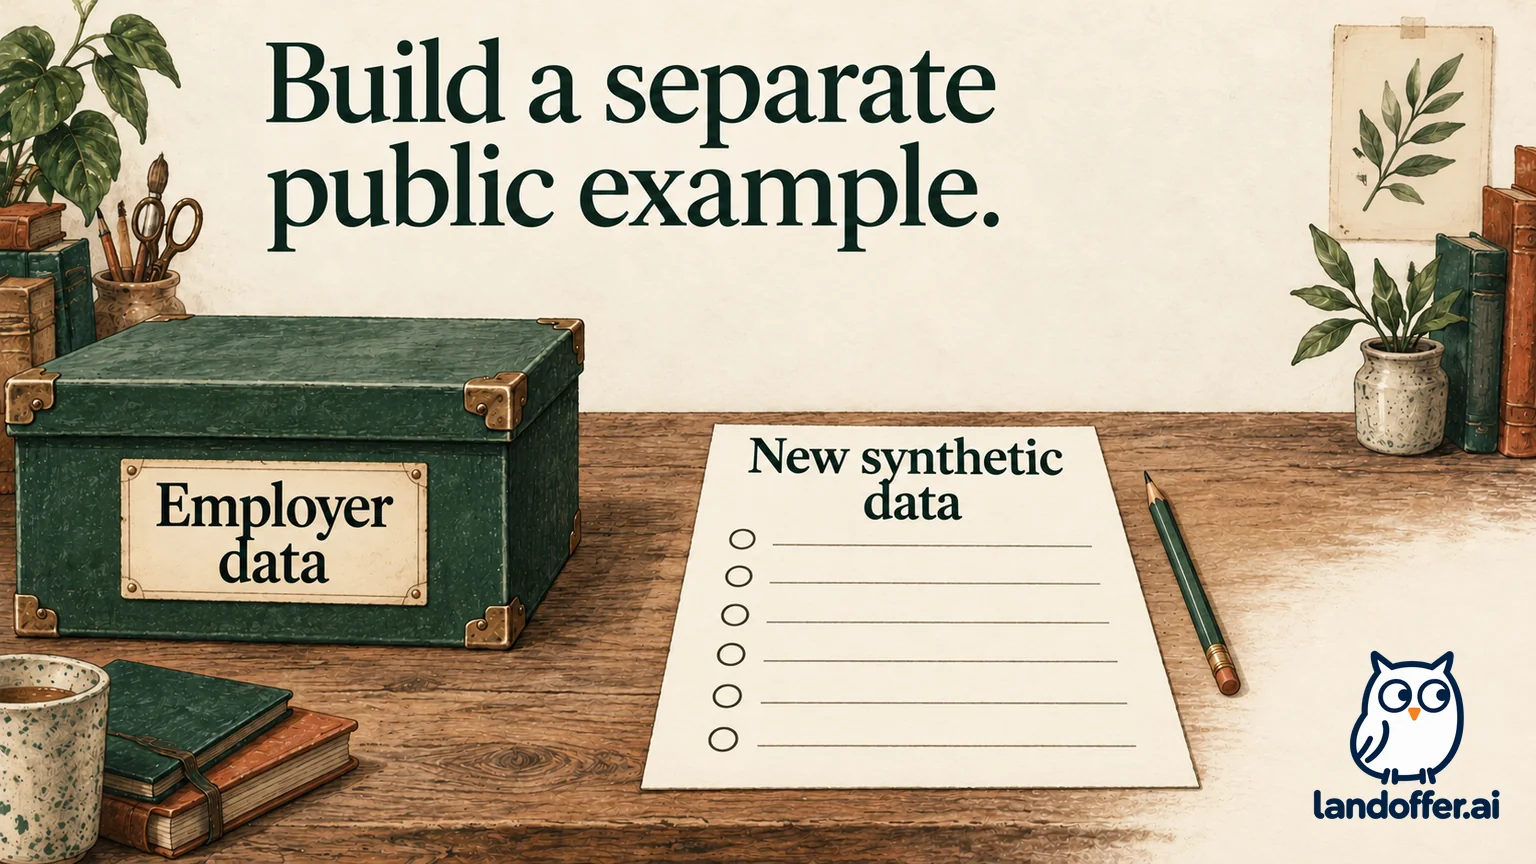
She wants to demonstrate a narrower skill: distinguishing ticket throughput from backlog change. She therefore creates a new six-row dataset from scratch, with two invented regions and three invented months. She does not copy the employer's rows, categories, totals, distributions, or screenshots. The resulting example teaches a calculation; it is not an anonymized version of her workplace.
| Material considered | Completed release decision | Reason |
|---|---|---|
| Original support workbook and extract | Exclude | No public-release authorization in this example |
| Ticket text with names removed | Exclude | Text and remaining context still belong to the private work |
| Screenshot with a few covered labels | Exclude | Covering labels does not settle release of the analysis |
| New region/month totals invented for teaching | Use with a synthetic-data label | Created independently; no private records or employer findings represented |
The decision changes what Nia can claim. She can say she designed a teaching example about backlog accounting. She cannot say the synthetic totals show her employer's operational improvement. If she discusses her workplace experience elsewhere, she still needs to describe only the facts she may share and her actual contribution.
It can feel disappointing to leave your strongest workplace dashboard out. The smaller example still gives you a specific calculation to defend and a clear reason for choosing shareable material. A concise explanation of a real analytical distinction gives a reviewer something defensible to examine. Adding a dozen invented business claims would make the case harder to trust, even if the page looked more substantial.
Complete the calculation before presenting the insight
Here is the full synthetic dataset. Each row is one region in one month. Opened and resolved are counts during that month; opening and closing backlog are stocks at its boundaries. In this teaching example, tickets are counted once when opened and once when resolved; there are no reopenings, transfers, or other backlog adjustments. Those assumptions simplify the example and would need review for a real support system.
| Region | Month | Opening backlog | Opened | Resolved | Closing backlog |
|---|---|---|---|---|---|
| North | January | 30 | 40 | 35 | 35 |
| North | February | 35 | 45 | 50 | 30 |
| North | March | 30 | 35 | 30 | 35 |
| South | January | 70 | 40 | 35 | 75 |
| South | February | 75 | 45 | 40 | 80 |
| South | March | 80 | 35 | 40 | 75 |
Every row satisfies opening backlog plus opened minus resolved equals closing backlog. Across the quarter, 240 tickets are opened and 230 are resolved. Total backlog moves from 100 at the beginning of January to 110 at the end of March. Summing all six closing-backlog cells would produce 330, but that repeats the stock across months; it is not the quarter-end backlog.
Likewise, 230 divided by 240 is about 95.8%. Nia labels that quantity “resolved count divided by opened count during the quarter.” She does not call it the percentage of newly opened tickets resolved. Some resolutions can concern tickets already in the opening backlog, and this aggregate dataset has no ticket-level linkage to identify that cohort.
The result is bounded but useful: under the stated assumptions, resolutions were ten fewer than openings, and the backlog grew by ten. It does not establish average response time, customer satisfaction, staffing adequacy, or why either region changed. None of those measures exists in the six rows.
For a proposed dashboard, Nia selects monthly opened-versus-resolved bars and a separate month-end backlog view. She uses explicit count labels and a note about the synthetic source. This is our completed design choice for the example, not an observed Tableau workbook. The saved six-row CSV passes each backlog equation and the continuity check between months. That is a local arithmetic result; Tableau calculated fields, workbook behavior, and hosted rendering were not tested.
Write the case note a recruiter can understand
Nia's finished portfolio annotation reads:
Support backlog: throughput and ending balance. This independent practice project uses six entirely invented region/month records. I defined the row grain, checked the backlog equation, and designed a comparison of openings, resolutions, and month-end backlog. No employer or customer data is included.
The quarter contains 240 openings and 230 resolutions. Ending backlog is 110, compared with 100 at the start. I show the final monthly stock separately from activity totals because adding monthly backlog balances would count the stock repeatedly.
The resolution/opening ratio is 95.8%; it is not a cohort completion rate. The data cannot link resolutions to tickets opened in the same period. It also contains no response-time or satisfaction measures. The example demonstrates metric definition and reconciliation, not a real operational outcome.
That annotation gives a reviewer a question, a contribution, a calculation, and a limitation without requiring a live narration. It also supplies an interview topic Nia can explain: why a plausible-looking ratio could be labeled incorrectly. She can walk through one row and the quarter reconciliation instead of saying only that she built a dashboard.
Match the annotation to the role. For an analyst opening, Nia could emphasize the metric interpretation. For a role requiring production data pipelines, this small CSV alone would provide limited evidence. She would need a separate permitted artifact showing relevant engineering work; a portfolio label cannot supply experience that the example does not contain.
Avoid claiming the project was commissioned, shipped, used by executives, or responsible for an improvement. A practice case has value when its purpose is clear. Its credibility comes from making the reasoning inspectable and preserving the difference between invented teaching data and actual business evidence.
Prepare the publication route and the reader's link
Tableau's first-visualization guide distinguishes browser authoring from Desktop Public Edition. Choose a route that fits your setup. This guide does not require you to install software merely to decide whether the material is suitable for a public portfolio.
For desktop publication, the current save guide documents Server, Tableau Public, Save to Tableau Public in Professional or Public Edition, followed by account sign-in and a workbook name. Desktop Free Edition is a different edition and cannot use that destination. The guide also documents editing workbook details, a permalink, and the Share link or embed code.
Give the work a title that communicates the question. “Support backlog: throughput and ending balance” is more informative than “Final dashboard version 7.” Add the synthetic-data disclosure and case note where a visitor can find them. Keep the link in the application near a brief description of what it demonstrates, following any employer-specific portfolio instructions.
Before sharing your own published project, open the exact intended link while signed out and on a phone as well as a desktop. For this example, check whether the opening view shows the quarter-end balance of110, whether month and region controls are understandable, and whether the synthetic-data and ratio limitations are visible. Those are proposed reader checks; we did not perform them on a Tableau-hosted workbook for this review. An owner session alone cannot establish what an outside reader will experience.
If an embedded version is difficult to use, preserve a direct visualization link as another way to reach the same work. A static image may explain the initial finding, but it does not demonstrate that an interactive link works. Record which deliverable you have actually reviewed instead of describing all formats as equally verified.
Keep the project small enough to explain honestly
Choose Tableau Public when public access fits the material. Keep confidential work out of that release, and use independently created teaching data or appropriately shareable sources when necessary. Nia's case succeeds as an explanation of stock, flow, and metric meaning; it does not need a fabricated employer result to justify its place in a portfolio.
Choose one target opening and compare its required work with what your case actually demonstrates. You can browse recent roles on LandOffer.ai for that step, or keep an opening you already found. If your existing public case already shows the relevant work clearly, keep it. Otherwise, finish one accurate case note and review its intended link before adding more charts. LandOffer does not certify data-release permission or predict how a recruiter will assess the work.